Friday, December 12, 2014

Anthropology on the Long Tail

Small Big Data?
Of the many hyperbolic predictions in bestselling books devoted to big data, none is more astounding than Mayer-Schönberger’s and Cukier’s claims that big data will eliminate the need for sampling (why sample when you’ve got all the data?). But here’s the thing. We don’t have all of the data. Let’s look at Twitter. First, people who tweet are not a representative sample of the population. Second, like most commercial platforms, Twitter has moved towards more proprietary policies on the data they have mined from us. Most of us can only access up to 1% of relevant tweets for a given query. That can still be a lot of tweets, and that data is, for the moment, free. But is that big data? In other words, we’ve got sampling bias. If you can detect it, though, you can correct for it—Morstatter et al recommend bootstrapping the data in order to correct for the biased sample.
But it may not be so easy with some of the work we do. For example, the authors note that the difficulties that researchers may have with the long tail of tweets—the 99 percent of hashtags that are not trending. Are these biased? And can that bias be corrected? Research so far has been on the popular terms–#Ferguson, #Obamacare. But for the most part, anthropologists study the long tail: the lives and perspectives of people engaged in quotidian action on a relatively small scale. Heck, we are the long tail: even if we engage in public anthropologies, those anthropologies (and their publics) rarely register a blip in the winner-take-all logic of power-law social media.
On the other hand, our fieldwork is rarely about achieving a certain sample size—it’s about collecting a range of experiences and practices and then contextualizing those results. With social media, we should take the same approach. We my not have big data, but we might use the same tools. And they can still be helpful, but not as a substitute for our painstaking, field research.
The following are two, quick examples of utilizing social network analysis for qualitative research drawn from a webinar I did for AAA in November (eventually to be posted on AAA’s YouTube channel). Both examples utilize a free and open source application for Microsoft Excel—NodeXL–which has the advantage of familiarity and also comes built-in queries for multiple SNS APIs: Twitter, YouTube, Flickr, and, with a little work, Facebook and hyperlink analysis. Finally, all of the complexities of graph theory are already built into the application.
In way of introduction: you’ve got nodes, dots representing people, concepts, organizations, etc., and edges, lines that represent some kind of relationship between the nodes. And although there are many ways we might analyze these relationships, for these examples I only use one measure of centrality—the relative importance of a node. Betweenness centrality ranks the importance of a node based on the number of times it’s crossed in the shortest path between all of the nodes in a graph to each other.
Who are my interlocutors?
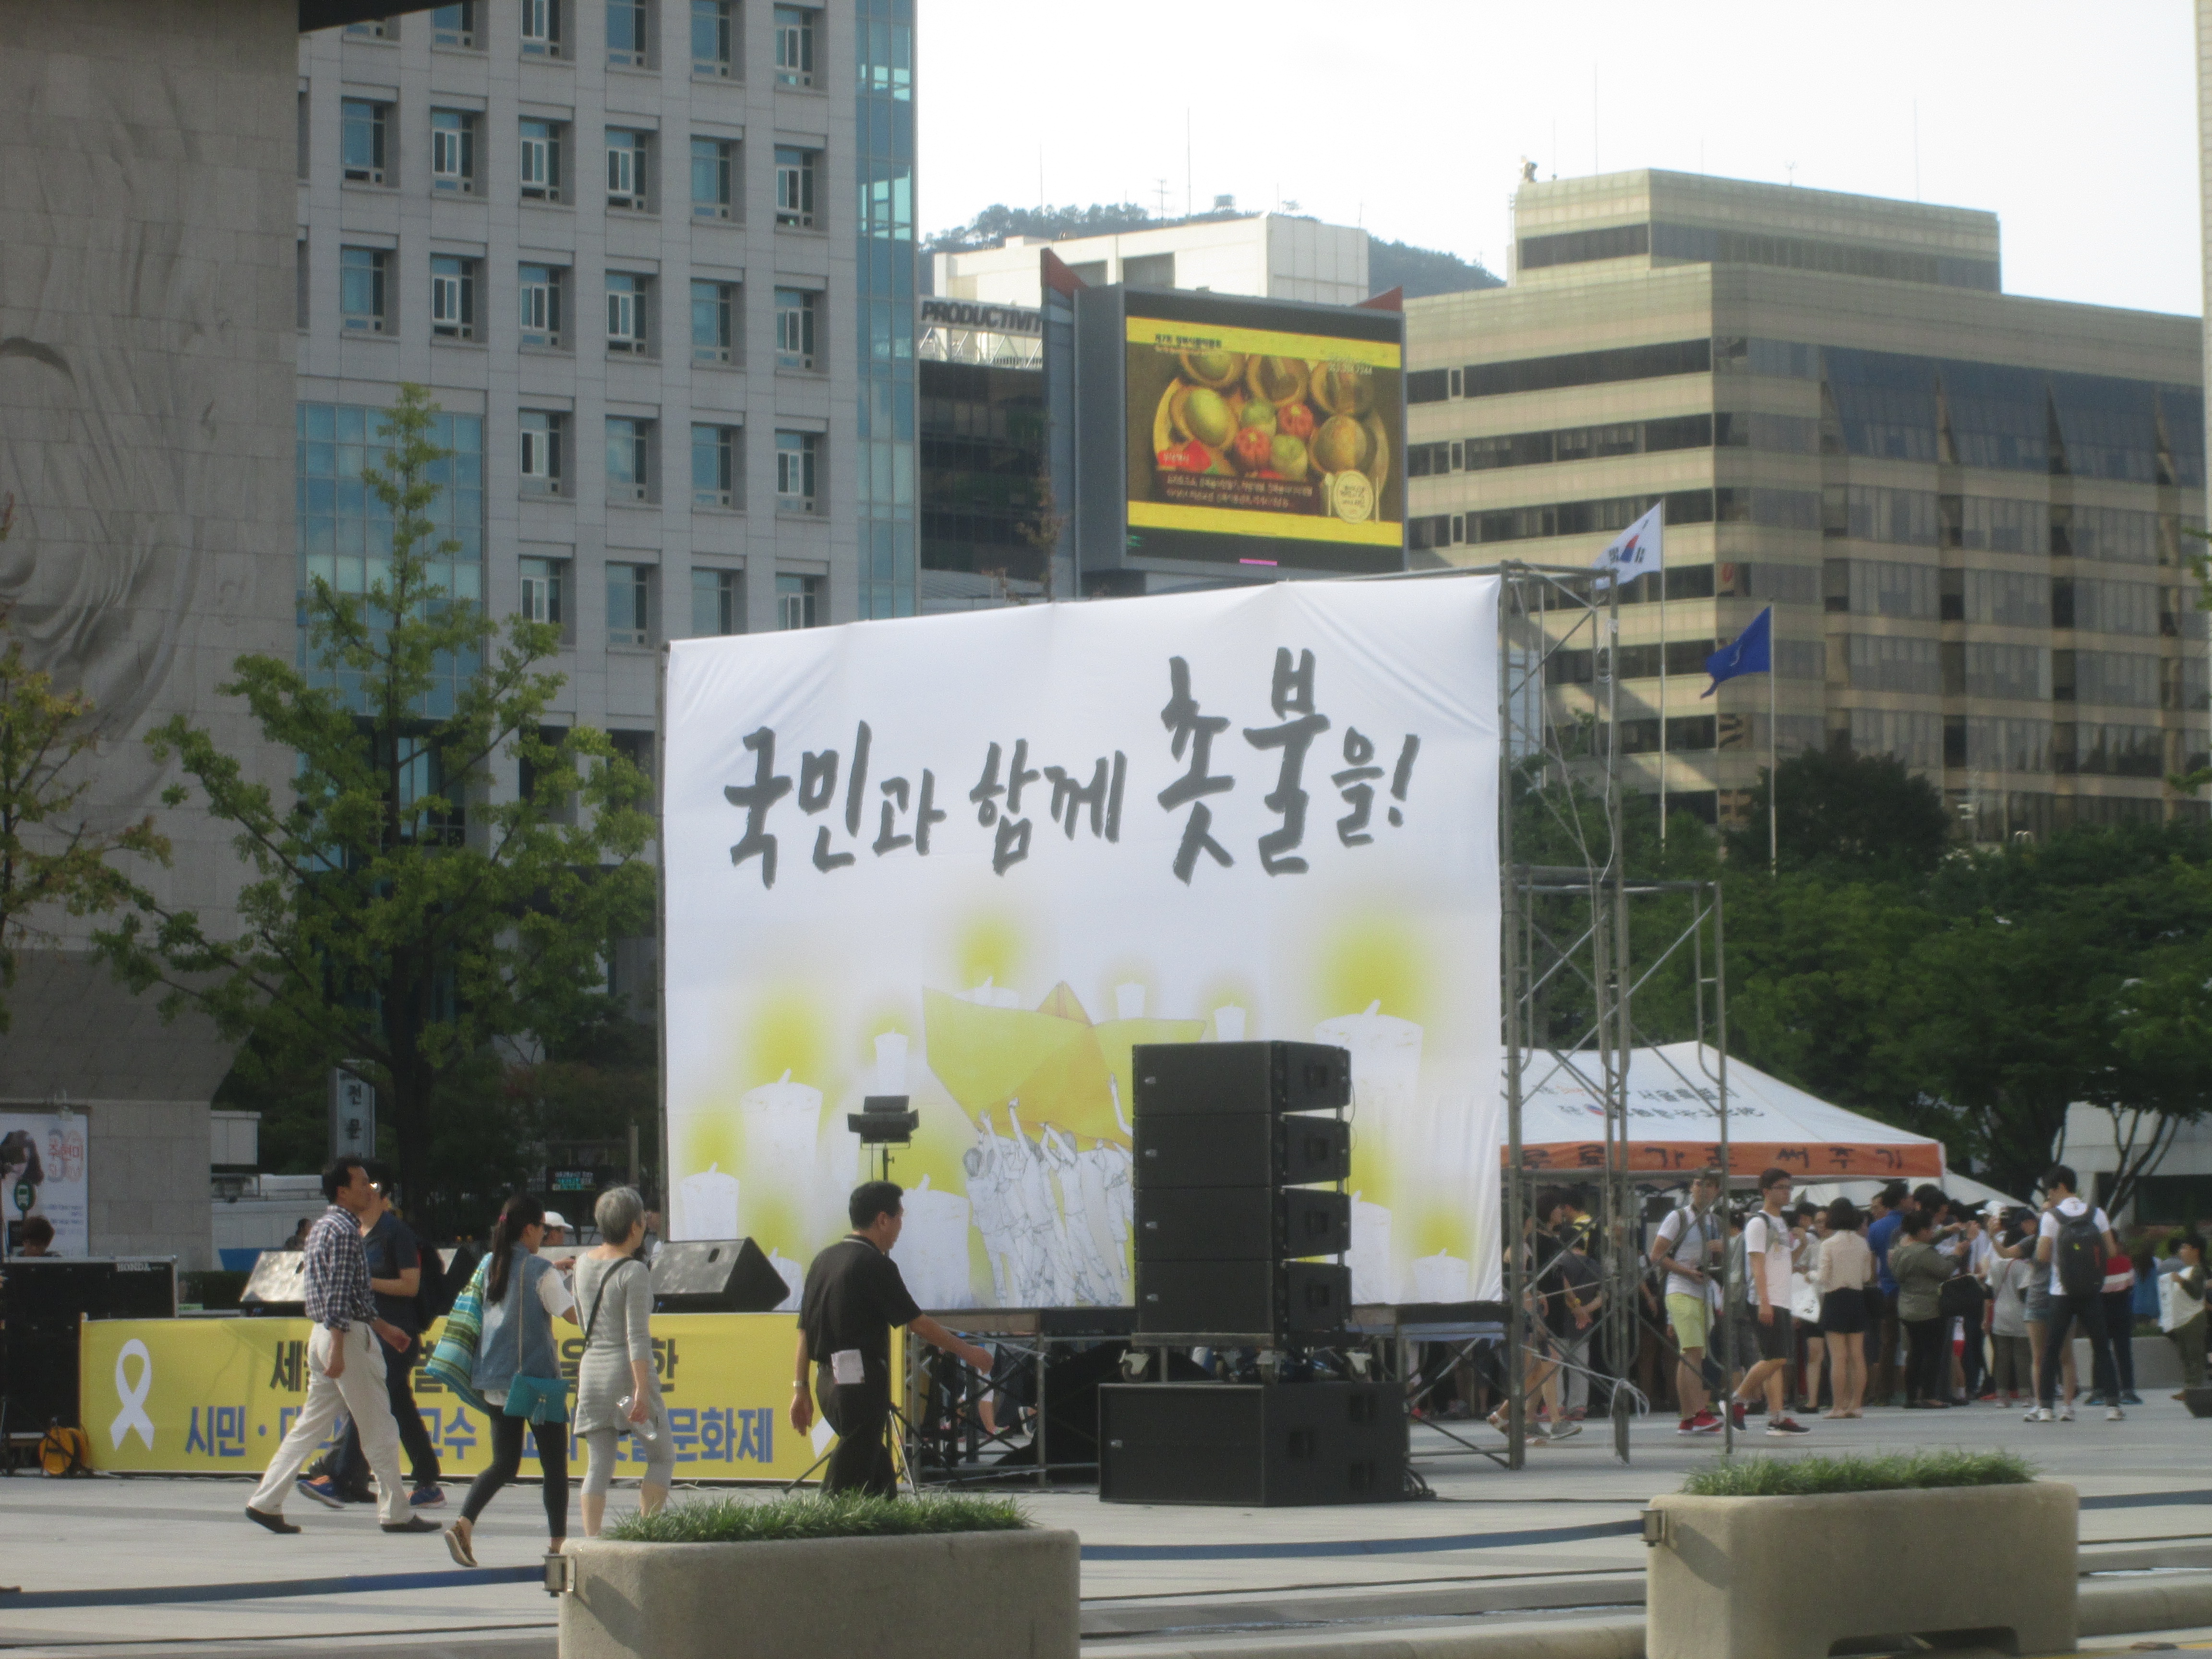
I’ve been researching the intersection of place and social network platforms in Seoul, and one of my favorite places has been Gwanghwamun Plaza. But it’s a crowded field of social action, with events
Screenshot of NodeXL
overlapping each other every day, a complexity reflected in the tweets containing Gwanghwamun. First, I use the drop-down menu on NodeXL to query the Twitter API.
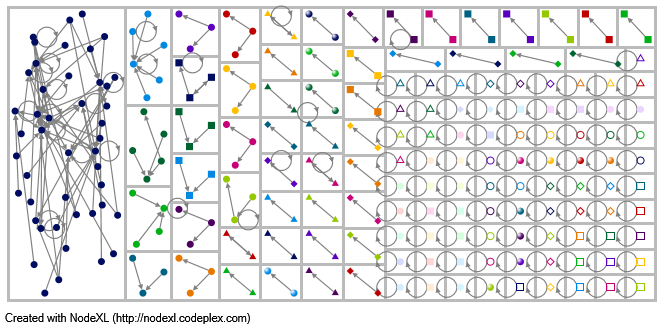
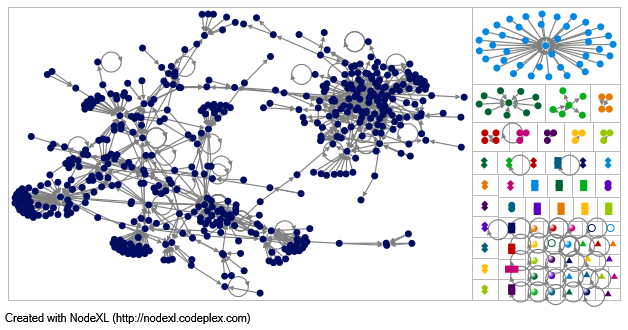
Choosing the Twitter Search Network, I enter in a search term 광화문 (Gwanghwamun) and set the parameters for my search. It returns 1528 vertices (dots) representing Twitter accounts connected by 1880 edges (lines) representing relationships between users who have  used the term, or users who were replied to or were mentioned in one of the tweets with that term. It’s pretty messy, but NodeXL gives us some options for ordering this chaos. After running metrics for the data, I have it group the nodes together into separate boxes by connected components.
Screenshot of Twitter users. Note that Twitter IDs have been cropped off
Now I’ve got something more manageable: a series of groups that share some thematic similarities. This can give me a sense of the demonstrations, counter-demonstrations, unconnected events and encounters that make up the social practice of this space. Moreover, I can rank the nodes by centrality to find the most important Twitter accounts. So now I have a sense of this field in a way that both is and is not co-extensive with the physical fieldsite, but
without obscuring the role of physical place: it does matter, after all, that the protest is happening here in Gwanghwamun and not in Second Life.

What does my event mean?
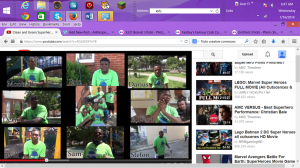
Honfest is a highly commercialized neighborhood festival concocted by a neighborhood entrepreneur in order to brand the neighborhood for commodified consumption. As such, it is a flashpoint of contention, a social drama that reveals the divisions around gentrification, race and class in this formerly working-class neighborhood in north Baltimore.
Twitter users grouped into boxes by connected component and ranked by betweenness centrality
We have sent students into the festival every year in order to document these negotiations. But we are not the only ones. Every year, there are hundreds of people posting their media on social networking sites like Instagram and Flickr. These images are important clues to the meaning of this event and analyzing these data can tell us much about the different ways people categorize space and place: photo elicitation and photovoice applied to social media platforms
Going back to the pull down import menu on NodeXL, I download the related tag network on Flickr for Honfest.
Screen Shot 2014-11-27 at 4.28.00 AM
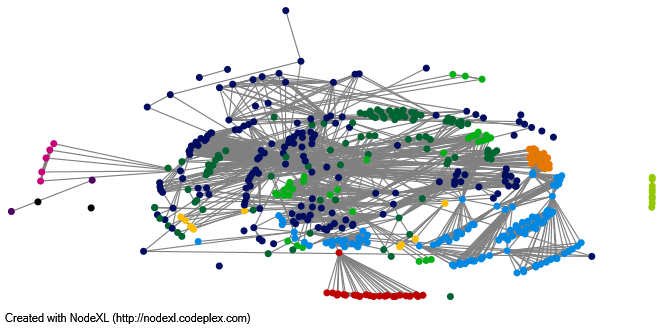
This graph shows the relationship between tagged terms, and, like the preceding example, this may prove too messy for analysis. So: we can again run metrics, and remove terms that occur less frequently in these photos.
Screen Shot 2014-11-27 at 4.28.05 AM
Now, we have honfest (at the center of the graph) surrounded by a constellation of terms that co-occur with it. Like the preceding example, I can rank these terms by betweenness centrality—and we find predictable terms: hairspray (the film and the hair product), beehive (the hair style), retro etc.
Concluding thoughts
Both of these examples represent ways that we might utilize socially networked data (rather than big data) to open up our ethnographic work to other meanings, interlocutors and social relations. In neither case is the critical need for face-to-face ethnography eliminated. In fact, just the opposite. In the first example, Twitter helps us to identify issues and people that might be salient to fieldwork, while in the second, tags suggest (but only suggest) different discourses swirling around an urban festival. Both are only first steps in different phases of a sustained, ethnographic project. In other words: in the absence of big data, we still have the tools (if not the truth claims) of big data. We can utilize them to enrich our small-scale, place-bound ethnographic research in ways that are complementary.

Wednesday, October 29, 2014

Tweeting the Hell Train

Moving Across Scale and Platform in Seoul

Walker, Rider, Smartphone Talker

In Ryu Shin’s 2014 Seoul Arcade Project, the author, in the persona of the “walker” (구보), explores Seoul through Benjamin’s “Arcades Project,” focusing on the phantasmagoria of Korean capitalism and spectacle over the course of a day’s travel from Gangnam to Gangbuk and back again.  That said, there are some significant differences between Ryu’s project and Benjamin’s, notably in the presence of two technologies altogether absent from Benjamin’s unfinished masterpiece: the smart phone and the subway.
More than just communication and travel, Ryu’s subway and smartphone combination fuels his narrator’s journey across multiple forms of transit to Seoul’s diverse spaces.  Here, the project is a renewed call for analyses of urban mobility systems, but not only that—it’s a call to look into the ways urban practice involves this assemblage of movement, technology and communication.  The challenge for anthropology is to be able to nimbly navigate these networked trails.
Seoul Metropolitan Subway, from Wikipedia Commons

The 1980s called, and they want their Cyberanthropology Back

In a curious artifact of the 1980s, anthropologies of digital life tend to concentrate their attention on those technologies to the exclusion of other technologies, relationships and spaces.  When they interview their interlocutors, it is in relation to those selfsame technological platforms: “What do you think about blogging”?  And yet, it seems obvious that life is lived across platforms, and nowhere more so than in our urban perambulations.
The idea of our networked lives as a complex assemblage is nothing new in Korea.  After a relatively slow start in the 1980s, college students began rapidly acquire beepers (삐삐) or, more formally, 무선호출기.  Each subway or bus station had lines of payphones for people who had received a page to call and (hopefully) rendezvous with their friends.  That is, the system worked in combination: telephone-beeper-subway-telephone.  Although the few, remaining payphones in subway stations are a curious anachronism, the smart phone-subway combination is the undisputed heir.  This is nowhere more obvious than in the adoption of Wibro (Wireless Broadband) on Seoul’s subways in 2009, an inestimable public service which provides free WiFi and, in the process, fuels the formation of new systems of digital mobility and communication.

Boarding the Hell Train

Let’s consider what’s often called the hell train (지옥철)—Line 2 of the Seoul subway.  It circles the downtown area, bringing crushing crowds of commuters and general despair.  Diving down a little deeper: Seoul City Hall Station lies on both Line 1 and Line 2.  It is also sits at the cross-roads of politics, tourism and culture in Seoul—next to plazas, palaces, Korean chaebol, embassies, etc.  It lies on
Tweets made between October 16 and 19th mentioning “City Hall Station”
the Sejong-no—and in doing so maintains a link to the city’s beginnings in the Joseon dynasty as well as its occupation by the Japanese and by the U.S. (the old City Hall was built during Japanese occupation).  It is also the subject of countless tweets.
Like most twitter graphs, the different components—comments, fragments of conversation–are unconnected, the thoughts and missives of people literally passing through.  Nevertheless, we can broadly characterize these tweets by their frequency:
Tweet ContentNumber of Tweets
Events and happenings near the station86
Characteristics or incidents at the subway station27
Transferring at the station16
People and incidents on the train14
Meeting at the station8
Restaurants near the station8
Passing the station (while walking, driving, etc.)8
Meeting near the station3
What’s interesting here: the lion’s share of tweets takes people outside of the station to meet people in physical spaces.  That is, twitter combines with the subway to facilitate an encounter or a meeting outside of the station in the city.
One of the small clusters of tweets (in the upper, right-hand corner) is for a particular meeting: the “시청역 동네잡지/ 시청역의 점심시간” (City Hall Station Neighborhood Magazine/ Lunch Time at City Hall Station).  The neighborhood magazine started with its editor’s (Hyeong-jeong Kim) curiosity.  As she explains to Hangyoleh21 Magazine, “[I wanted to know] the faces and the stories that these people that you pass quickly every day at the subway station on their way to buildings in this area and back again.”  After initial meetings for lunch, they decided to start making a neighborhood magazine with contributions from people who rode the subway together and worked in the same neighborhood: familiar strangers of the city.
Kim started organizing meetings on Facebook, announcing meet-ups, deadlines and new issues to people who had “liked” the page.  In this graph, the different clusters (represented by different colors), are each linked to different issues of the magazine and to related events, including calls for participation, meetings, classes, production and publication announcements: the posts succeed each other likes waves radiating different centers to reach a diverse group that includes the core team members, contributors, and members of the community including people overseas.
facebookcityhallstationlunch-2
Graph of Facebook Community page showing co-likes and co-posts
Each magazine issue features prose and poetry from contributors that ranges from thoughts about restaurants around City Hall Station (“People Feeding You Around City Hall Station”) to meditations on summer trips (“My Summer Vacation”). The upcoming issue, “Patronage” (단골), takes readers into area coffee shops, restaurants and bathrooms (“Grading City Hall station bathrooms by order of priority”).
In addition to the magazine content, networks extend from this work to the different restaurants and coffee shops where the magazine is being distributed, to area non-profits who are affiliated with the magazine through their website or their Facebook page.  The network begins broadly, contracts to a point, and then expands again in the creation of new edges and new nodes—the digital rhythm of life in a networked city.

Where Digital Scholars Fear to Tread

When we’re looking at social media, the tendency is to just examine the social media.  And yet, the examples here form complex systems that include space, mobility and digital communication: an actor network made up of subway + subway station + twitter + face-to-face meetings + Facebook + physical magazines and, like Line 2 of Seoul’s subway, back again.  The jumps in scale and platform are not, I would submit, incidental to this process: they trace social action in a complex environment made up of varying systems of mobility, social connection and communication.  This is a trail only an anthropologist can follow.  Accordingly, next steps for this research include interviews and observations of everyday life–for these are ultimately the quotidian ways we organize our lives in a networked world.
[This post originally appeared in Anthropology News].  

Tuesday, October 28, 2014

Saturday, October 25, 2014

The 2014 Battisti Award for best article


Goes to an article I published in Utopian Studies:

Train to Pyongyang: Imagination, Utopia, and Korean Unification
From: Utopian Studies
Volume 24, Number 1, 2013
pp. 119-143 | 10.1353/utp.2013.0013
Abstract
Abstract:

This essay is motivated by the seeming contradiction that Korean unification is sought after by most Koreans yet speculations about the social and cultural changes it might bring are almost absent. This may be because Korean unification denotes a series of differences contrasted to the present—because it is a potent “master symbol” with one foot in utopian speculation and the other in policy studies. In this essay, I outline some of the complexities, starting with an examination of illustrations of unification in textbooks for the tensions and contradictions they introduce. I then turn to fiction and film, sketching not only what some South Koreans hope (or fear) will happen after unification with the North but, indeed, the limits of their imagination regarding what the future will hold for South Korea. In the end, I concur with Grinker that representations of unification are “utopian,” but I object to the association of “utopia” with a socially engineered straitjacket. On the contrary, the utopias projected here suggest stepping off a precipice into worlds unknown, futures defined by their radical difference from today. The end of the essay locates these more imaginative dimensions of Korean unification in the “hope” of Ernst Bloch.

My thanks to the Society for Utopian Studies and to the journal.  

Saturday, October 4, 2014

Routledge Interview with Matthew Durington and Samuel Collins

We discuss our new book, and the potentials for networked anthropology in general.   Here, by the way, is the wonderful cover (with a design inspired by Kelly Brady).  


Monday, September 22, 2014

Twitter on the Plaza

The Spatial Practice of Online Social Networks

What are the relationships between the city and the social media used in the city?  I assume that social media have had an impact on the ways we relate to the city.  This, after all, was one the goals in utilizing Twitter in #Occupy protests—to organize people in space.  During those protests, social media helped evoke alternatives to hegemonic spaces structured by capital flows.   On the other hand, I also assume that social media is shaped by historic and contemporary urban practice—by flanerie, by different systems of mobility, by contemporaneous technologies such as books, newspapers, earphones, and by the history of media in the city.
But how do we understand this give and take?  Many of the analyses of Twitter in the city have been variations on Big Data: that is, work has tended to answer questions about large-scale movements of ideas and discourse.  In the process, many of the small questions about place and meaning have not been as interesting to Big Data scientists.  But here’s one area where anthropology has some real advantages.  We may (at least for the moment) be able to download thousands of tweets—a global population. But, ultimately, these micro-communications are local: the thoughts of people embedded in place (not withstanding robots and zombies).
Korea (where I’m on a Fulbright grant for the 2014-2015 year), offers me an opportunity to explore these ideas.  Not only are smartphone penetration levels higher in Korea than in the U.S. (70%-66% in the U.S.), but, more importantly, the practice of smartphones is different.  Koreans are more likely to use their smartphones on the go, with Koreans showing significantly higher mobile internet usage when on the go (e.g., taking the subway) or in third spaces (cafes, restaurants, etc.) (“Our Mobile Planet”).  Accordingly, Koreans are more likely to update their Twitter accounts while they’re moving around (“Our Mobile Planet”).

Network Types

In a recent Pew Research Center report, Marc Smith, Lee Rainie, Itai Himelboim and Ben Schneiderman suggest that Twitter communications might be grouped into predictable typologies based on the type of communication and the relationship between Twitter account holders.  For example, the Polarized Crowd features 2 tight clusters with few connections between them, the Broadcast Network has a hub and spoke structure with people re-tweeting the broadcast message, while the community cluster type features different groups forming around common topics (Smith et al 2014).
These typologies are extremely useful in characterizing Twitter’s discursive space.  But what if we expand those insights into physical space?  Could we see similar parallels between communications in social networks and spatial practice?  What would we look for?

Seoul—City of Plazas

Over the past ten years, downtown Seoul has been transformed in many ways—new parks, the restoration of Gwanghwamun, the opening of major thoroughfares to pedestrian traffic—all alongside a
A small, right-wing protest squeezed between a concert stage and the Gwanghwamun subway.  Photo courtesy Samuel Collins
A small, right-wing protest squeezed between a concert stage and the Gwanghwamun subway. Photo courtesy Samuel Collins
ruinous bout of “re-development” (재개발) that has led to widespread gentrification.  And, interestingly, the construction and/or transformation of public plazas. Since its completion in 2008, Gwanghwamun Plaza (광화문 광장) has provided highly effective visibility for social movements.  On the other hand, the plaza has also figured into city and national-efforts at “branding” and commodification through the creation of spectacle; indeed, there is rarely a day when there are not multiple events and attractions.
Nothing typifies this tension between different spatial practice along the plaza more than the ongoing protests by the grieving families of the children lost to the Sewol ferry accident (세월 유가족) and
A stage for a candlelight vigil being erected next to a crowded booth giving away inspirational calligraphic inscriptions for the family.  Photo courtesy Samuel Collins
A stage for a candlelight vigil being erected next to a crowded booth giving away inspirational calligraphic inscriptions for the family. Photo courtesy Samuel Collins
their many supporters, all of whom have been waging a lengthy and highly visible protest in Seoul’s plazas since spring of 2014.  In addition, there have been protests from a right-wing group as well, one whose smaller numbers are belied by the attention given them by the conservative press.  Finally, there has been a continuous series of events and entertainments at the Plaza during the same period—sometimes these have been consonant with the Sewol protests, as in the August 2014 visit from Pope Francis where he articulated his support for the Sewol families.  More often, however, the events have been disconnected—unlikely bedfellows sharing the same space.

Online Spatial Practice

Back in the Twitterverse, I used NodeXL to download twitter data from September 11-13 (2014) using the keyword “Gwanghwamun” (광화문).  Stripped of identifying labels and grouped by connected components, the search yielded about 700 nodes (Twitter accounts) connected to each other by over 1000 edges.

Graph courtesy Samuel Collins
Based on the graph, we can see several different events and/or groups, all utilizing the plaza at the same time.  The clusters in the largest box are tweets regarding the Sewol protests, with the large cluster on the left side of the box associated with the Sewol families, and to the right the right-wing group against any special investigation into the Sewol ferry disaster.  On the right of the graph are a series of smaller boxes, declining in number to isolated self-tweets at the bottom.  These smaller, disconnected clusters are broadcasting events in Gwanghwamun Square; the smallest are personal messages (“Meet me at Gwanghwamun Square”).
Sewol protestors in different tents along Gwanghwamun Plaza.  Photo courtesy Samuel Collins
Sewol protestors in different tents along Gwanghwamun Plaza. Photo courtesy Samuel Collins
What’s important here is that these different elements reflect different kinds of spatial practice. In the Marc Smith et al model, the first type, the broadcast network, shows itself in a typical radial pattern—the organizers broadcasting their event.   Accordingly, people at these events (free calligraphy, performance or concerts) came as individual consumers (whether singly or on units of family and friends).  They lined up to consume at different booths, and having consumed the event, went their separate ways—the plaza practiced according to the spectacle of tourism and consumption.
The Sewol protest shows clusters of tightly connected Twitter accounts, linked by multiple connections between them.  This seems somewhere between a community cluster (within the coalition of Sewol protestors) and a polarized crowd (between the protesters on the left and the right-wing group on the right).  Physically, the Sewol activists are likewise divided into coalitions (for example, religious groups supporting the Sewol families), each of which occupies separate tents along Gwanghwamun Plaza.  On the other hand, the right-wing encampment is down the plaza and across the street—occupying one tent.  Moreover, the Sewol protest camp involves different groups each enacting different forms of social activism (fasting, praying, etc.) towards a common goal of legislative change.
The point here is not to make any easy predictions about what spatial practice might look like based on Twitter networks, but to suggest that those intersections may constitute a rich source of data for anthropological investigation, mutually enforcing patterns of practice across both physical and virtual spaces that may not tell us much about big data, but may reveal something of local practices of social media.

Thursday, August 21, 2014

Attack of the Social Media Zombies

My colleague, Matthew Durington, and I have just finished our final iteration of a 4-year collaborative project, Anthropology By the Wire.   From the outset, we sought to produce
YouTube Video from this year's Anthropology By the Wire, "Clean and Green Superheroes". Photo courtesy of Samuel Collins.
YouTube Video from this year’s Anthropology By the Wire, “Clean and Green Superheroes”. Photo courtesy Samuel Collins
counter-narratives to David Simon’s “The Wire,” alternative representations that contest urban imaginaries of Baltimore premised on crime and drugs.  Through collaborative productions shared through social media, we have tried to challenge the directionality of these representational regimes by making local media disseminated on YouTube, Tumblr and Flickr.
But what we have realized is that the urban imaginary (as LiPuma and Koelbedescribe it), is constituted not only by representations of urban circulation, but the imagination of the circulation of those representations of circulation (and it may be circulations all the way down).  In other words, it is not only the representations of the city that allow people to understand themselves and others, but the way people imagine that those representations circulate.
As mass media, “The Wire” (and other television and film evocations of the city) is imagined to circulate through an audience: a mass that desires and consumes media, that can be characterized by demographic analyses, and that, finally, can be packaged and sold to advertisers.  It’s the imagined gaze of that homogeneous “mass” that has been so devastatingly effective in slotting Baltimore as “Other”: as a racial and class alterity that becomes the subject for critique and intervention.
Photo courtesy Kamau Collins
Stereotypical Spectacles of Baltimore: Abandoned Industry. Photo courtesy Kamau Collins via Flickr
In many ways, this idea of mass audience has been profoundly challenged by the widespread adoption of social media; to some media scholars, we are all “prosumers” now.  But the social media platforms that communicate our work draw upon other circulation imaginaries.

The Spectacle City

The first is an extension of the flanerie that marked the city as a site of male privilege a la Charles Baudelaire.  In the postmodern logic of late capitalism, this means the city as an extension of individual identity.  In his prescient Soft City (1974), the writer Jonathan Raban put it best: “Decide who you are, and the city will again assume a fixed form around you.”  In other words, the city exists as a foil for the elaboration and construction of one’s identity.  Raban’s Soft City is echoed in countless films (Ferris Bueller’s Day Off) and endless postmodern spectacle, where the city becomes a site for personal consumption and successive elaborations of commodified identity.
Social media has been erected on this capitalist scaffolding.  First, social media is ultimately personal social media—the city as an object for individual consumption on instagram and pinterest.  With social media, life may be constituted as “an immense accumulation of spectacles” (a la Guy Debord), but those representations are inward-focused, with the spectacle of the city laid out as a buffet of representations to take and share with a circle of intimates: pictures of lunch and dinner, of urban desolation, street festivals, alternative fashion.  Superficially ethnographic, each of these images and videos are mobilized as a projection of self to a cluster of acquaintances.

The Contagious City

Photo courtesy of jpellgen.
Crab Cakes. Photo courtesy jpellgen via Flickr
Alongside the privileged flanerie of the 19th century city came panics over pollution and contagion, with the 1864 Contagious Disease Act targeting the poor and dissolute as sources of “pollution” to the flanerie of upper-class men.  Today, theories of “contagion” are deployed epidemiologically, but they are also utilized to represent the spread of information in networks, the spread of crime in cities (the “broken window” theory) and in the virality of social media.
In each case, the question of contagion becomes a network problem.  In any cascade of information, disease, new technologies, new ideas, what percent of a given social network configuration needs to be “infected” before it can spread to the remainder?  When media go viral, they have passed this cascading “tipping point,” and a number of network scholars are currently examining the morphology of networks for clues to the virality of content.
Photo courtesy Nick Hall
Zombies during the Baltimore Marathon. Photo courtesy Nick Hall via Flickr
Although contagion seems like the opposite of the individuated consumption of the city, it is really its logical counterpart, with each individual first atomized into her own media telecocoon before influencing her neighbors.  It’s not by mistake that zombies have become such a ubiquitous figure in social apps and movies about the city.  If I imagine myself as active in my individualized consumption of the spectacle of the city, than everyone else can only be a zombie, a node through which my influence propagates.  In other words, as a form of circulation, we imagine social media to be composed of individuals and zombies: people who tweet, and people who propagate that tweet.
For our social media circulation of Baltimore, we therefore imagine not only media producers (those who represent Baltimore and share their representations on social media), “consumers” (those who watch the media we’ve produced), but also this interstitial category of social media zombies that pass along the links to our YouTube media and blog posts—who do the work of network propagation.  In this respect, much of our social media tagging can be considered varied forms of zombie food: keywords that encourage re-posting and that stimulate networked cascades.  Tagging your photo “urban ghetto” precipitates one form of contagion, while tagging the same shot “gentrification and abandonment” generates quite another.  Yet these lines of contagion are only possible in the imagined circulation of individual consumption and, in the end, we need to be mindful of our zombies lest they overtake us altogether.

The Ends of the Urban Imaginary

The last scene of Akira shows Tetsuo exploding out of his body with tendrils of flesh and machine.  Often interpreted as an apocalyptic, nuclear vision of Tokyo, it is simultaneously one where the differences between people and between places are eviscerated: Tetsuo’s monstrous appendages engulf his friends and enemies, traduce geographies, brachiate uncontrollably through Tokyo.
For me, Akira is a metaphor for the limits of our imaginaries of circulation.  It’s the ends of these two imaginaries—the individual spectacle and the contagious zombie—pushed to their limits until social media itself has become something monstrous where the city, the individual and the community disappear into circulatory flows.  In these scenarios, new configurations of the circulatory imaginary implode into non-representation.  Do we have an alternative?  Ultimately, our efforts to replace one circulatory imaginary with another—as Bruno Latour and Marilyn Strathern have shown—will ultimately produce more monstrous imaginaries.  Who will save us from our zombies then?
(Second photograph courtesy Kamau Collins; Third photo courtesy jpellgen; Fourth photo courtesy Nick Hall)
[Originally Published in Anthropology News]

Multimodal Interrogations of Anthropologically Unintended Media - Video link

Matt Durington and I had a wonderful time giving a talk at UBC Okanagan. Thanks to Dr. Fiona McDonald and the Collaborative and Experimental...