In Korean SF, the Internet has been important from the 1990s, with a lot of writers serializing their work online before landing themselves book contracts. But the importance of Internet platforms extends beyond print to a variety of multimedia, and I have also been considering webtoon representations of Seoul. Here are a couple:
1). 일호선 (이은재). (Line 1). The usual zombie-love story, with a mysterious plague turning most of Seoul's residents into flesh-eating zombies. You know the drill.
2). 레테 (Lethe). 강도하. Imagining the afterlife as existing as a shadow in Seoul's 서촌 neighborhood.
One of my projects in Seoul this year has been collecting representations of the city in Korean science fiction. Even if we exclude (for the moment) cinema, that still leaves a lot of interesting work that represents the city (and, by default, Seoul). This project has been immeasurably helped by an incredible resource in Seoul: the Science Fiction a (SF & 판타지 도서관). Here's what I've been working on in chronological order:
1). 문윤성. 완전사회 (1967). Yun-seong Mun. The Perfect Society.
2). 강경옥. 노말 시티 (1993-). Gyeong-ok Gang. Normal City.
3). 윤태호. 야후 (1999). Tae-ho Yun. Yahoo.
4). 배명훈. 타워 (2009). Myeong-hun Bae. Tower.
5). 김이환. 절망의 구 (2009). I-hwan Kim. The Orb of Despair.
6). 김이환. 동네전쟁 (2011). I-hwan Kim. Neighborhood War.
I think we can all agree that this is a quirky list, one that is shaped by the interesting history of SF in Korea as well as my own ignorance. I'll be filling in this timeline as I go along . . .But time is something I don't have much more of--I'm back to my mid-sized, state university in August. So any suggestions would be helpful!
Of the many hyperbolic predictions in bestselling books devoted to big data, none is more astounding than Mayer-Schönberger’s and Cukier’s claims that big data will eliminate the need for sampling (why sample when you’ve got all the data?). But here’s the thing. We don’t have all of the data. Let’s look at Twitter. First, people who tweet are not a representative sample of the population. Second, like most commercial platforms, Twitter has moved towards more proprietary policies on the data they have mined from us. Most of us can only access up to 1% of relevant tweets for a given query. That can still be a lot of tweets, and that data is, for the moment, free. But is that big data? In other words, we’ve got sampling bias. If you can detect it, though, you can correct for it—Morstatter et al recommend bootstrapping the data in order to correct for the biased sample.
But it may not be so easy with some of the work we do. For example, the authors note that the difficulties that researchers may have with the long tail of tweets—the 99 percent of hashtags that are not trending. Are these biased? And can that bias be corrected? Research so far has been on the popular terms–#Ferguson, #Obamacare. But for the most part, anthropologists study the long tail: the lives and perspectives of people engaged in quotidian action on a relatively small scale. Heck, we are the long tail: even if we engage in public anthropologies, those anthropologies (and their publics) rarely register a blip in the winner-take-all logic of power-law social media.
On the other hand, our fieldwork is rarely about achieving a certain sample size—it’s about collecting a range of experiences and practices and then contextualizing those results. With social media, we should take the same approach. We my not have big data, but we might use the same tools. And they can still be helpful, but not as a substitute for our painstaking, field research.
The following are two, quick examples of utilizing social network analysis for qualitative research drawn from a webinar I did for AAA in November (eventually to be posted on AAA’s YouTube channel). Both examples utilize a free and open source application for Microsoft Excel—NodeXL–which has the advantage of familiarity and also comes built-in queries for multiple SNS APIs: Twitter, YouTube, Flickr, and, with a little work, Facebook and hyperlink analysis. Finally, all of the complexities of graph theory are already built into the application.
In way of introduction: you’ve got nodes, dots representing people, concepts, organizations, etc., and edges, lines that represent some kind of relationship between the nodes. And although there are many ways we might analyze these relationships, for these examples I only use one measure of centrality—the relative importance of a node. Betweenness centrality ranks the importance of a node based on the number of times it’s crossed in the shortest path between all of the nodes in a graph to each other.
Who are my interlocutors?
I’ve been researching the intersection of place and social network platforms in Seoul, and one of my favorite places has been Gwanghwamun Plaza. But it’s a crowded field of social action, with events
Screenshot of NodeXL
overlapping each other every day, a complexity reflected in the tweets containing Gwanghwamun. First, I use the drop-down menu on NodeXL to query the Twitter API.
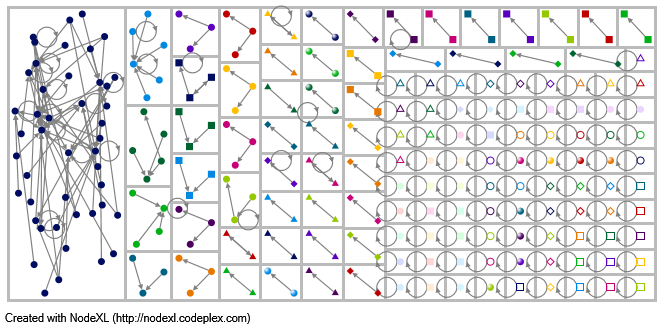
Choosing the Twitter Search Network, I enter in a search term 광화문 (Gwanghwamun) and set the parameters for my search. It returns 1528 vertices (dots) representing Twitter accounts connected by 1880 edges (lines) representing relationships between users who have used the term, or users who were replied to or were mentioned in one of the tweets with that term. It’s pretty messy, but NodeXL gives us some options for ordering this chaos. After running metrics for the data, I have it group the nodes together into separate boxes by connected components.
Screenshot of Twitter users. Note that Twitter IDs have been cropped off
Now I’ve got something more manageable: a series of groups that share some thematic similarities. This can give me a sense of the demonstrations, counter-demonstrations, unconnected events and encounters that make up the social practice of this space. Moreover, I can rank the nodes by centrality to find the most important Twitter accounts. So now I have a sense of this field in a way that both is and is not co-extensive with the physical fieldsite, but
without obscuring the role of physical place: it does matter, after all, that the protest is happening here in Gwanghwamun and not in Second Life.
What does my event mean?
Honfest is a highly commercialized neighborhood festival concocted by a neighborhood entrepreneur in order to brand the neighborhood for commodified consumption. As such, it is a flashpoint of contention, a social drama that reveals the divisions around gentrification, race and class in this formerly working-class neighborhood in north Baltimore.
Twitter users grouped into boxes by connected component and ranked by betweenness centrality
We have sent students into the festival every year in order to document these negotiations. But we are not the only ones. Every year, there are hundreds of people posting their media on social networking sites like Instagram and Flickr. These images are important clues to the meaning of this event and analyzing these data can tell us much about the different ways people categorize space and place: photo elicitation and photovoice applied to social media platforms
Going back to the pull down import menu on NodeXL, I download the related tag network on Flickr for Honfest.
This graph shows the relationship between tagged terms, and, like the preceding example, this may prove too messy for analysis. So: we can again run metrics, and remove terms that occur less frequently in these photos.
Now, we have honfest (at the center of the graph) surrounded by a constellation of terms that co-occur with it. Like the preceding example, I can rank these terms by betweenness centrality—and we find predictable terms: hairspray (the film and the hair product), beehive (the hair style), retro etc.
Concluding thoughts
Both of these examples represent ways that we might utilize socially networked data (rather than big data) to open up our ethnographic work to other meanings, interlocutors and social relations. In neither case is the critical need for face-to-face ethnography eliminated. In fact, just the opposite. In the first example, Twitter helps us to identify issues and people that might be salient to fieldwork, while in the second, tags suggest (but only suggest) different discourses swirling around an urban festival. Both are only first steps in different phases of a sustained, ethnographic project. In other words: in the absence of big data, we still have the tools (if not the truth claims) of big data. We can utilize them to enrich our small-scale, place-bound ethnographic research in ways that are complementary.
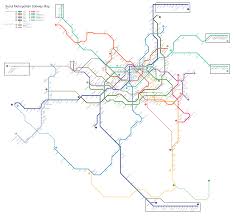
In Ryu Shin’s 2014 Seoul Arcade Project, the author, in the persona of the “walker” (구보), explores Seoul through Benjamin’s “Arcades Project,” focusing on the phantasmagoria of Korean capitalism and spectacle over the course of a day’s travel from Gangnam to Gangbuk and back again. That said, there are some significant differences between Ryu’s project and Benjamin’s, notably in the presence of two technologies altogether absent from Benjamin’s unfinished masterpiece: the smart phone and the subway.
More than just communication and travel, Ryu’s subway and smartphone combination fuels his narrator’s journey across multiple forms of transit to Seoul’s diverse spaces. Here, the project is a renewed call for analyses of urban mobility systems, but not only that—it’s a call to look into the ways urban practice involves this assemblage of movement, technology and communication. The challenge for anthropology is to be able to nimbly navigate these networked trails.
Seoul Metropolitan Subway, from Wikipedia Commons
The 1980s called, and they want their Cyberanthropology Back
In a curious artifact of the 1980s, anthropologies of digital life tend to concentrate their attention on those technologies to the exclusion of other technologies, relationships and spaces. When they interview their interlocutors, it is in relation to those selfsame technological platforms: “What do you think about blogging”? And yet, it seems obvious that life is lived across platforms, and nowhere more so than in our urban perambulations.
The idea of our networked lives as a complex assemblage is nothing new in Korea. After a relatively slow start in the 1980s, college students began rapidly acquire beepers (삐삐) or, more formally, 무선호출기. Each subway or bus station had lines of payphones for people who had received a page to call and (hopefully) rendezvous with their friends. That is, the system worked in combination: telephone-beeper-subway-telephone. Although the few, remaining payphones in subway stations are a curious anachronism, the smart phone-subway combination is the undisputed heir. This is nowhere more obvious than in the adoption of Wibro (Wireless Broadband) on Seoul’s subways in 2009, an inestimable public service which provides free WiFi and, in the process, fuels the formation of new systems of digital mobility and communication.
Boarding the Hell Train
Let’s consider what’s often called the hell train (지옥철)—Line 2 of the Seoul subway. It circles the downtown area, bringing crushing crowds of commuters and general despair. Diving down a little deeper: Seoul City Hall Station lies on both Line 1 and Line 2. It is also sits at the cross-roads of politics, tourism and culture in Seoul—next to plazas, palaces, Korean chaebol, embassies, etc. It lies on
Tweets made between October 16 and 19th mentioning “City Hall Station”
the Sejong-no—and in doing so maintains a link to the city’s beginnings in the Joseon dynasty as well as its occupation by the Japanese and by the U.S. (the old City Hall was built during Japanese occupation). It is also the subject of countless tweets.
Like most twitter graphs, the different components—comments, fragments of conversation–are unconnected, the thoughts and missives of people literally passing through. Nevertheless, we can broadly characterize these tweets by their frequency:
Tweet Content
Number of Tweets
Events and happenings near the station
86
Characteristics or incidents at the subway station
27
Transferring at the station
16
People and incidents on the train
14
Meeting at the station
8
Restaurants near the station
8
Passing the station (while walking, driving, etc.)
8
Meeting near the station
3
What’s interesting here: the lion’s share of tweets takes people outside of the station to meet people in physical spaces. That is, twitter combines with the subway to facilitate an encounter or a meeting outside of the station in the city.
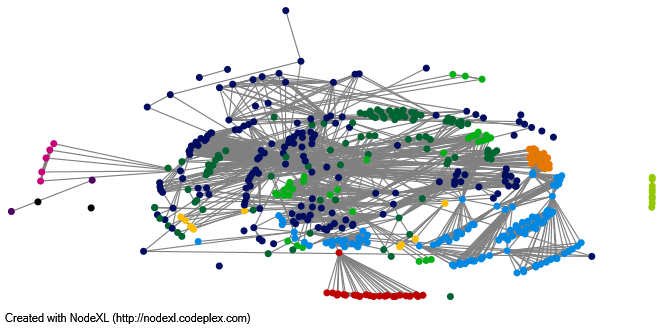
One of the small clusters of tweets (in the upper, right-hand corner) is for a particular meeting: the “시청역 동네잡지/ 시청역의 점심시간” (City Hall Station Neighborhood Magazine/ Lunch Time at City Hall Station). The neighborhood magazine started with its editor’s (Hyeong-jeong Kim) curiosity. As she explains to Hangyoleh21 Magazine, “[I wanted to know] the faces and the stories that these people that you pass quickly every day at the subway station on their way to buildings in this area and back again.” After initial meetings for lunch, they decided to start making a neighborhood magazine with contributions from people who rode the subway together and worked in the same neighborhood: familiar strangers of the city.
Kim started organizing meetings on Facebook, announcing meet-ups, deadlines and new issues to people who had “liked” the page. In this graph, the different clusters (represented by different colors), are each linked to different issues of the magazine and to related events, including calls for participation, meetings, classes, production and publication announcements: the posts succeed each other likes waves radiating different centers to reach a diverse group that includes the core team members, contributors, and members of the community including people overseas.
Graph of Facebook Community page showing co-likes and co-posts
Each magazine issue features prose and poetry from contributors that ranges from thoughts about restaurants around City Hall Station (“People Feeding You Around City Hall Station”) to meditations on summer trips (“My Summer Vacation”). The upcoming issue, “Patronage” (단골), takes readers into area coffee shops, restaurants and bathrooms (“Grading City Hall station bathrooms by order of priority”).
In addition to the magazine content, networks extend from this work to the different restaurants and coffee shops where the magazine is being distributed, to area non-profits who are affiliated with the magazine through their website or their Facebook page. The network begins broadly, contracts to a point, and then expands again in the creation of new edges and new nodes—the digital rhythm of life in a networked city.
Where Digital Scholars Fear to Tread
When we’re looking at social media, the tendency is to just examine the social media. And yet, the examples here form complex systems that include space, mobility and digital communication: an actor network made up of subway + subway station + twitter + face-to-face meetings + Facebook + physical magazines and, like Line 2 of Seoul’s subway, back again. The jumps in scale and platform are not, I would submit, incidental to this process: they trace social action in a complex environment made up of varying systems of mobility, social connection and communication. This is a trail only an anthropologist can follow. Accordingly, next steps for this research include interviews and observations of everyday life–for these are ultimately the quotidian ways we organize our lives in a networked world.
Congrats to Samuel Gerald Collins for winning the 2014 Battisti Award for best article in 'Utopian Studies' (2013, 24:1)! #susmtl14
— SUS (@utopianstudies) October 25, 2014
Goes to an article I published in Utopian Studies:
Train to Pyongyang: Imagination, Utopia, and Korean Unification
This essay is motivated by the seeming contradiction that Korean unification is sought after by most Koreans yet speculations about the social and cultural changes it might bring are almost absent. This may be because Korean unification denotes a series of differences contrasted to the present—because it is a potent “master symbol” with one foot in utopian speculation and the other in policy studies. In this essay, I outline some of the complexities, starting with an examination of illustrations of unification in textbooks for the tensions and contradictions they introduce. I then turn to fiction and film, sketching not only what some South Koreans hope (or fear) will happen after unification with the North but, indeed, the limits of their imagination regarding what the future will hold for South Korea. In the end, I concur with Grinker that representations of unification are “utopian,” but I object to the association of “utopia” with a socially engineered straitjacket. On the contrary, the utopias projected here suggest stepping off a precipice into worlds unknown, futures defined by their radical difference from today. The end of the essay locates these more imaginative dimensions of Korean unification in the “hope” of Ernst Bloch.
My thanks to the Society for Utopian Studies and to the journal.